After poring through thousands of lines of data, faculty and students in Bentley University's masters of business analytics program may have discovered the way to engineer the perfect Kickstarter campaign. By analyzing the elements in tens of thousands of successful projects, the Data Analytics Research Team found what separates the success stories from the failures.
Analyzing Kickstarter
Kickstarterchas successfully provided funds for just under 80,000 projects. Countless entrepreneurs, artists, engineers and aspiring business owners use the service to raise thousands of dollars in a short period of time — money they may not have received otherwise. Today, roughly $1.45 billion has been pledged to various Kickstartercprojects.
Roughly 60 percent of projects fail on Kickstarter.
This doesn't paint the whole picture, though. The majority of these fundraising campaigns fail. Business hopefuls pour incredible amounts of time and resources into operations that ultimately leave them penniless once the financing goal isn't achieved. Kickstarter is an all-or-nothing platform. If a fundraising goal isn't reached by a certain time, the creators get nothing — even if they fall behind by just one dollar.
That means there's a high incentive to put together an engaging and popular program to attract the most backers. However, there's no guaranteed method of doing this. No matter how great an idea is or how much time is poured into launching an engaging strategy, roughly 60 percent of projects fail on the website. Worse yet, a plethora of bloggers and other online sources claim they know how to put together a successful campaign without studying the numbers or putting together a credible scientific analysis. Bentley DART studied the numbers.
Researching Millions of Components
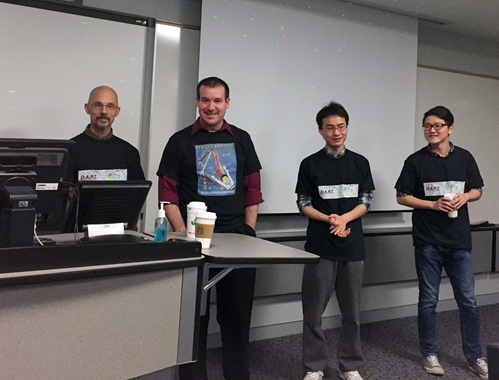
According to the team members — who are pictured above — a single Kickstarter project has somewhere close to 5,000 lines of data. All the measurable variables — project goal, category, duration, launch month, deadline, geographic location, description word count — they're all there, but siphoning through the data is the big challenge. Even finding a computer capable of running the numbers proved to be difficult. DART went through several laptops that crashed in the process.
To boil everything down into a measurable dataset is a tremendous task, and doing it in a manner that gives credibility to the research is even trickier. Here's the DART process in a nutshell.
- The team scraped lengths of code and data from Kickstarter using two programs: Python and R.
- This data, roughly 88 lines of code per project, then needs to be decoded — a process that produces around 5,000 lines of code per project.
- From that collection of code, the team has to separate the valuable statistics, grabbing just the "cleaned" data in the endless sea of Javascript Object Notation.
- After aggregating the usable information, it's time to turn those thousands of data points into some meaningful statistics, which DART did by using five different analytics software packages: SAS Enterprise Miner, SPSS Modeler, Salford Systems, Alteryxcand Heuristic Labs.
- The software packages are used collectively. Because they each analyze the data differently, the information from one system can be used to fill the gaps of another, producing the most well-rounded and dependable information possible.
Using this process, DART found out what variables are the most important aspects of creating a successful Kickstarter. The team discovered where the highest percentage of campaigns are started in the country, when the perfect time to launch is statistically, exactly what monetary goal sees the highest rate of success and much more. Using this information, a potential Kickstarter fundraiser could turn a project that once may have been a risky gamble with a 60-40 split into something with a much higher potential for success.