In the 2015 Oscar season, data science went Hollywood for a team of Bentley PhD candidates. Their research on analytics techniques explored a must-have for the silver screen and computer screen alike: high-impact visuals.
“Visualization is an important component used for understanding the dynamics of any network, but it has traditionally been difficult when it comes to movie analytics,” says Dominique Haughton, professor of mathematical sciences and global studies. “Researchers have struggled with a way to visualize very large data sets, as typical tools run into problems.”
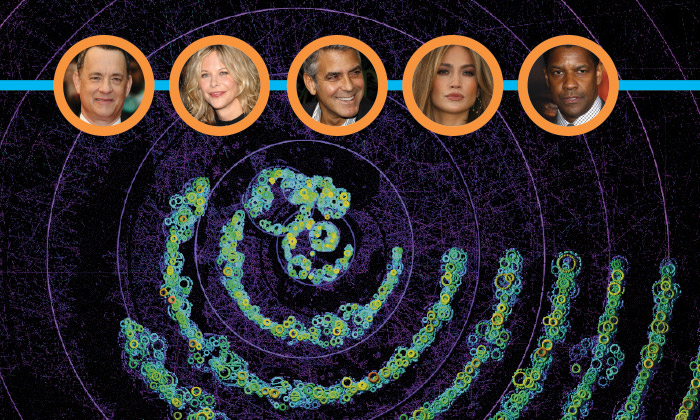
Project principals were Mark-David McLaughlin, Kevin Mentzer and Changan Zhang — students in the PhD Quant V course that Haughton teaches. They applied different analytics techniques to see which generated the best charts, graphs and other means of representing large, complex data sets. Information for the test case came from the Internet Movie Database (IMDb), whose network of co-stars includes 2.6 million actors with upward of a billion connections.
They compared a “k-core” approach to visualizing data with a more traditional technique to see which would best illustrate connections and degrees of separation among co-stars. How many times has Tom Hanks worked with Meg Ryan?
And the Oscar goes to … k-core. “We were able to illustrate that k-core can overcome limitations, such as memory issues, that arise from processing huge amounts of data,” says Haughton. “Our approach presented findings in a visually appealing way.”
Plot Points
The research explored other aspects of movie analytics, a domain that Mentzer says is understudied. For example, they looked at online predictions of Oscar winners and developed a how-to guide for text mining online movie reviews related to the Academy Awards.
“An interesting finding with movie reviews is that movie complexity matters, but only to a certain degree,” explains Mentzer. “In order to win Best Picture, for example, you need a plot that appeals to many different groups for different reasons — too simple a plot and you don’t have a large enough base of support, but too complex you lose votes because people start getting confused.”
Bentley researchers analyze what makes for an award winning movie as the #oscars approach #bentleyu
TWEET THISAnd...Action!
The movie analytics project follows a longstanding model of faculty-student collaboration at Bentley. Her belief in such partnerships inspired Haughton to co-found the Data Analytics Research Team (DART). Students and professors use a wide range of analytical and modeling techniques to investigate data sets in areas such as global studies and living standards, marketing, health care, media and finance.
“Analytics has a different flavor now, as more and more people recognize the importance of the data and the usefulness of the tools,” says DART member David Oury. The lecturer in mathematical sciences is spearheading a campus-based data lab with software and hardware to support course curriculum and DART research. “Students and faculty are using analytics technologies to explore how data can impact business and operations, and how it can help create more productive and efficient procedures.”
And Hollywood take note: Researchers recognize the need to present big data in ways that non-scientists can understand and appreciate. For example, to showcase the movie analytics findings, Haughton hosted an on-campus Oscar party complete with red carpet, replica trophies and proper attire. Of course the event featured flashy visuals: a laser show set to Billy Joel’s It’s Still Rock ‘n Roll to Me.
Haughton credits DART and similar partnerships for “an impressive amount of cross-disciplinary co-publication by students and faculty. There are clear connections among areas such as math, geography, economics, sociology, statistics, global studies, marketing and computer science. Those are strong measures of success.”
The research team’s monograph — Movie Analytics: A Hollywood Introduction to Big Data — was published in November as part of the SpringerBriefs in Statistics series.