Introduction
Recently, our team at the Bentley UXC embarked on a multifaceted project in partnership with a mid-sized property insurance company to help the company to better understand their policyholder population. The company’s goal was to discern ways to improve their policyholders’ experiences with the company, which, consequentially, would then allow the company to maintain and increase their policyholders’ satisfaction and loyalty. Specifically, together we sought to learn more about policyholders’ needs, thoughts and questions, points of satisfaction and dissatisfaction, and the details of their user journey as they navigated the various stages of property insurance purchase and membership. Our collective goals were:
- To deeply understand the policyholder experience and journey by performing fifty individual hour-long interviews with policyholders from a variety of backgrounds;
- To create personas based on the insights we gained;
- To map out a detailed user journey map that would represent the different stages, goals, decision points, and emotions policyholders experienced as they moved from the initial need to purchase property insurance, through the various stages of membership, including: initial research, selecting a carrier, engaging with the carrier, filing a claim, and renewing their contract, or leaving for a different carrier.
Initial Thoughts and Considerations
We assembled a team that included a senior UXC researcher and two UXC research associates. Gathering an hour’s worth of qualitative data from fifty diverse people results in a lot of accumulated information. Since it would be difficult for one person to hold this much information in mind, and because each team member would be conducting interviews, we needed to come up with ways to collectively organize and share the information with each other so that each team member could form as comprehensive a sense of the population’s data as possible. We decided to utilize several collaborative software platforms: Dovetail, Miro, and Figma, to capture, analyze, and visualize the data in different ways. While some of our human-centered techniques were standard – analyzing the qualitative data with a system of tagging and categorizing – other aspects of our approach were more unique, created in an evolving manner as we explored how to group the data in ways that could organically capture data patterns and illuminate key themes associated with policyholders’ user journeys. With this accomplished, we could envision personas that represented groupings of relevance. A more detailed explanation of our process follows.
Our Process
Meetings and Collaborative Workshops:
To begin the research, our team met with the user-experience team at the client insurance company to learn more about the company’s goals for the project and to enable them to share any insights into their policyholders’ experiences. We then visited the company three additional times to listen in on call sessions with several departments: billing, claims, and the switchboard. We listened as company personnel interacted with policyholders, agents, and other callers. These glimpses into the types of questions and requests held by the policyholders gave our team an initial sense of direction for various stages of the users’ journeys and specific points of satisfaction and dissatisfaction. Between customer calls, we interviewed the department team and learned what constituted a “typical” call, how the industry was evolving from their perspective, and asked questions about their role and the finer points of their industry. We took detailed notes during the call sessions and then uploaded these notes into the Dovetail app.
Dovetail is a cloud-based program that offers multiple ways of analyzing qualitative data and collaborating amongst teammates. Amongst other features, the program includes interview transcription, the ability to create multitiered categorization tags, and features for organizing tagged notes on boards for more organized viewing. In Dovetail, we coded our notes to tag relevant phrases, key quotes, and other information that would later reveal major themes we had gleaned from the calls. For our project, a downside of Dovetail was that it could not be used for creating diagrams or tables (aside from the programmed templates given) that would better support our goals.
Brainstorming Interview Questions:
At this point, we began to brainstorm the questions we would ask policyholders during the fifty individual interviews we planned to conduct. In collaboration with the insurance company team, we created a long list of questions and then consolidated them into categories that reflected an evolving picture of the user journey stages that were beginning to take shape in our minds. Meanwhile, a third-party recruiter working under our direction began to schedule policyholders to meet with our team virtually for the one-hour interviews. Over time, we divvied up the interviews amongst the Bentley team members, sharing insights at the end of each day to build a collective understanding of the emerging themes
Interviews and Initial Analysis:
We recorded each interview we conducted via Zoom, while also taking detailed notes directly into the Dovetail app during the interviews, and filled in any gaps in the notes by revisiting the recordings again afterward. By uploading our Zoom recordings to Dovetail, Dovetail could create a transcript of the sessions. After about five interviews, we began to analyze the notes and transcripts in Dovetail, utilizing the tags we had previously defined, alongside many additional ones we created as new themes became apparent. These represented: 1) The property ownership stage and property relationship of each person; 2) The key stages (major and subsidiary, definite and potential) of their user journeys; 3) Their questions, considerations, and emotions they associated with each stage; 4) Their self-described levels of tech-savviness and understanding of the insurance process and policies; 5) The modes of communication they used or preferred; 6) Their relationship with their insurance agent and with the company directly; 7) Their “insurance personality” (such as “set it and forget it”, or, at the other end of the spectrum, “meticulously review my options yearly”); 8) The areas of satisfaction and dissatisfaction they experienced; 9) Their positive and negative experiences with the claims, billing, and portal processes; 10) Factors that might cause them to consider changing companies; and 11) Any ideas they had for improving their own experience as policyholders.
Creating a Miro Board:
After analyzing about twenty interviews in Dovetail, we began to discuss what tool would best support the affinity diagramming we planned to perform based on our Dovetail tags and the emerging themes we observed. Since this project was in support of a discovery phase, we needed ways to include flows and diagrams to assemble our thoughts and help capture patterns of the emerging themes. A member of the team created a Miro board project, where she made a long horizontal list of virtual sticky notes, each containing a major aspect of the policyholders’ mental models, questions, or journey stages.
After collectively organizing the notes, we identified overarching journey stages, then listed subcategories and differentiating factors beneath each major theme, and added key findings from each policyholder we interviewed beneath the relevant headings or subheadings. If a newly interviewed policyholder indicated an insight or potential trend that was different from its cohort, we created a new note to capture that theme. Over time, as we grouped policyholders, qualities shared by all or most policyholders became apparent to us, as well as the areas in which they differed significantly. One such differentiating example was the way in which some policyholders relied deeply on their agents to conduct all insurance related tasks, whereas others relied more on their own personal research or on contacting their insurance company directly. Even within just those two differentiating categories, there were subdividing qualities that further divided them into different persona types, all captured visually on the ever-more-complex Miro board.

Discerning Personas:
Next, while continuing to conduct interviews, we worked together in another area of our Miro board to draft several initial personas that captured the defining aspects of the different types and trends of the policyholders we had interviewed so far. For example, some policyholders we interviewed were very technologically oriented and preferred to do as much as possible by email or in an online portal, whereas others preferred the personal or tactile touch of phone calls and paper mail. We noticed a multitude of similar and differentiating features that we worked to characterize into personas that collectively represented the emergent policyholder groups. As we continued to interview the remaining policyholders and to analyze interview notes, we collaboratively tweaked each persona to fit our more comprehensive findings. We eventually wound up with six distinct personas that we and the client team felt were accurately representative of the larger policyholder population.
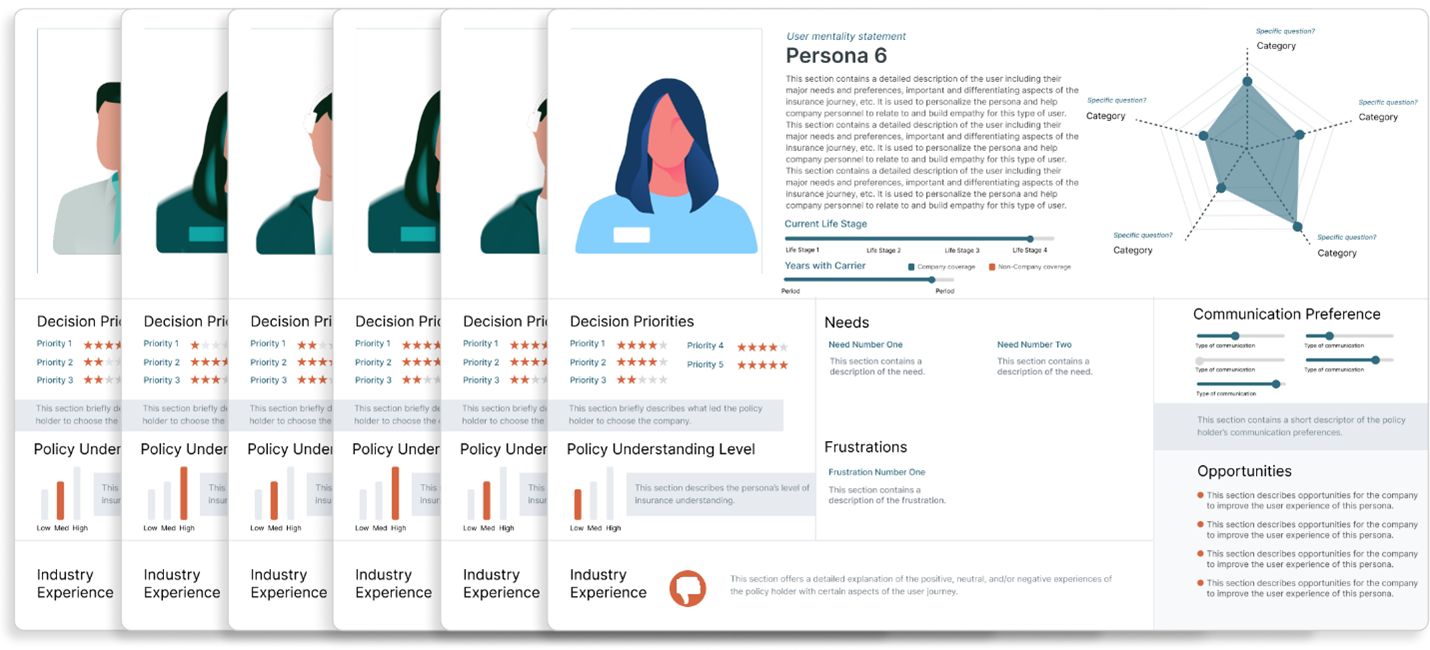
From there, a member of our group created a template in Figma to display each persona, which included a title, image, and brief description of each fictional, but representative “person.” Figma is a cloud-based collaboration tool that enables the creation of “print ready” documents and high fidelity, interactive and clickable prototypes. Similarly to how the joint team interacted with Miro, any team member could edit the Figma documents as they evolved.
Figma supported our creation of persona templates using the client company’s visual style guide. As we worked we explored ways to visually represent each persona’s life stage, the amount of time they had been property insurance policyholders, their decision-making priorities when choosing an insurance carrier, their communication preferences, their insurance understanding level, claims experience, goals, frustrations, comfort with technology, and other defining aspects. With a combination of images, graphs, and other forms of data visualization, as well as short verbal descriptors, we captured the defining aspects of each persona in a relatable, information-packed, and eye-catching format. Below is a sanitized version of the personas.

Creating the Journey Map:
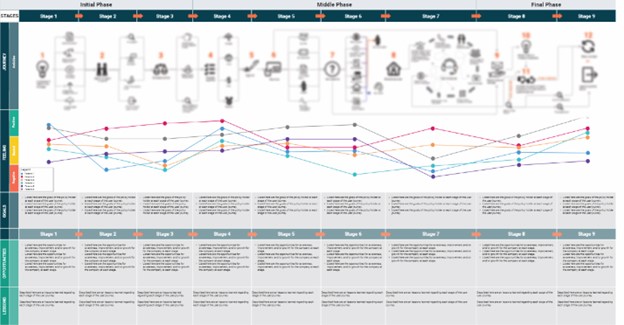
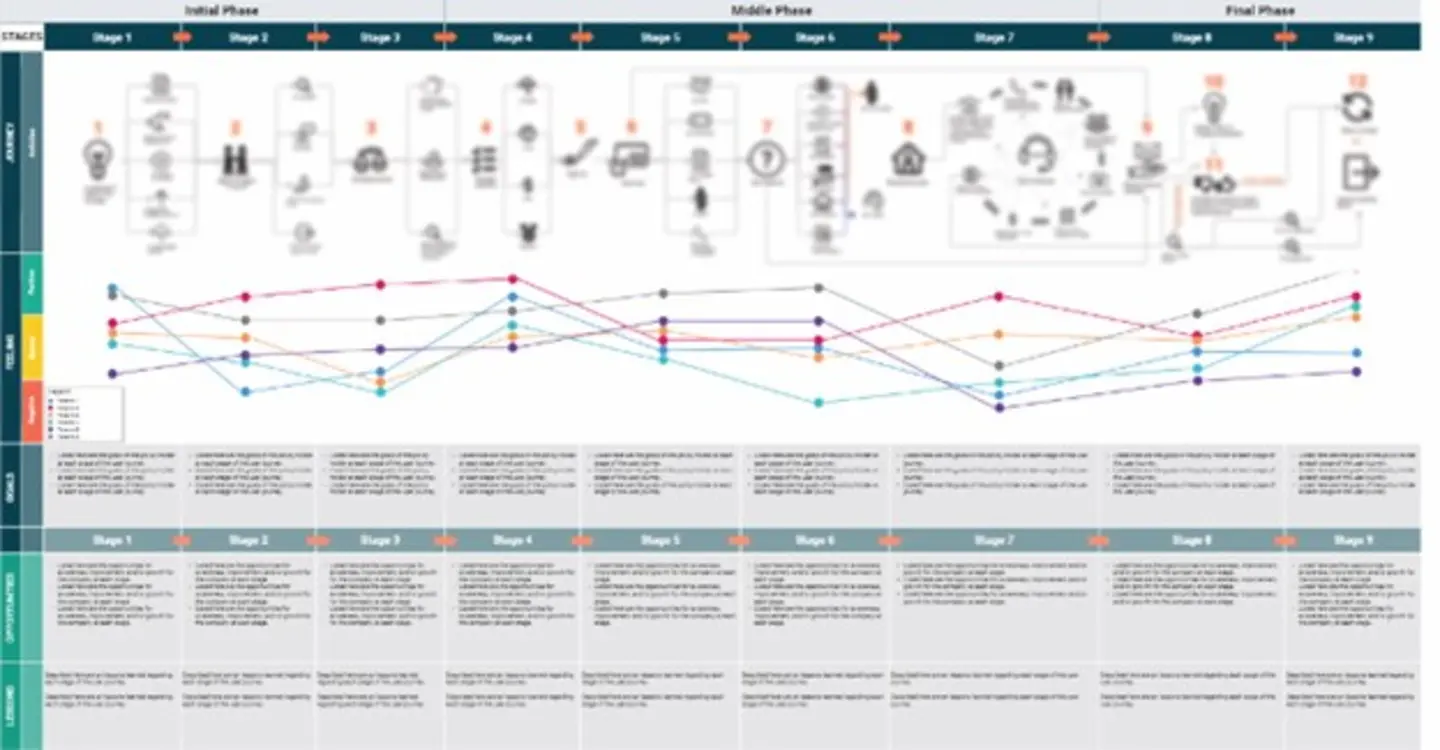
With a clear understanding of our six personas, it was time to draft the journey map. We began with a joint-team collaborative brainstorming workshop to understand which aspects of the journey we wanted to capture, such as policyholders’ stages, questions, goals, and emotions, as well as opportunities and insights for the company. One of our team members created a journey map template in Miro and built a system of icons and arrows to represent the various stages, sub stages, and decision points a policyholder would go through during their “insurance-related journey. These stages encompassed the sweep from their initial awareness of the need to purchase property insurance through all the major stages of the journey – from the search process and consideration of options, to the point of deciding upon a carrier and plan, to paying bills, asking various questions about coverage and other membership aspects, filing claims and interacting with independent contractors, considering renewal, and choosing to renew their insurance or seek another insurance carrier. We debated whether we needed a journey map for each persona, but decided to create one map that incorporated all six journeys, with ways of differentiating certain aspects of each persona within the larger map. The colored lines in the center of the document shown below indicate each individual persona and its representative emotional journey’s highs and lows.:

Beneath each stage (and the many substages not listed above in the sanitized screenshot), these colorful lines and decision points represented the degree of positive, neutral, or negative emotional experience of each of our six unique personas at each stage. After defining this section, we brainstormed the goals of each persona at each stage, and then listed the opportunities for the company at each stage for retaining the loyalty of their policyholders and that might increase their policyholder membership. Finally, we finalize the journey map by including lessons we had learned about the policyholders themselves, their experiences, and preferences, which the company could keep in mind when making strategic decisions about their future policies and operations.
Final Presentation and Aims
With our finalized high-fidelity visuals – the personas in Figma and the journey map in Miro – as well as other information the insurance company team had put together, the client team was able to present our combined findings to the company board in a way that deeply personalized the policyholder population, creating greater empathy and awareness of their experiences and casting light onto the aspects of the process that the company was doing well as well as areas for growth and improvement. The client team created poster-sized, high-quality handouts of these deliverables to share with their C-suite. These evidence-based and artful artifacts would allow the company’s leadership specific, evidence-based touchpoints they could use to strategize approaches for better understanding, retaining, and increasing the loyalty of their policyholders. Because these deliverables were created directly from the research artifacts and data collected in earlier stages of the project, the stakeholders and the client team could dive into the entire data “chain of custody,” detailing where the item came from, how commonly we heard it, and its context. These personas, paired with the journey map, served as strategic references for the client company’s growth and development, and will continue to, as they explore ways to further satisfy policyholders at every stage of their journey, and to bolster the company’s already strong reputation and long history of success. Since receiving these deliverables, the joint team has received praise for the precision, accessibility, and value of the insights presented within them. This collaborative process not only enabled us to reaffirm the value of UX work done in depth and well, but afforded us the opportunity to collaborate intensely through emergent tools including Dovetail, Miro, and Figma. We commend our client for trusting in, and adhering to, this sequential human-centered design process, and thank them for including us in such an interesting engagement!

Meryll is a Research Associate at the User Experience Center. Before joining the team, she worked as a UX Designer at Centivo. In this role, Meryll focused on improving prototypes of member and provider applications (web and smartphone) to make them more comprehensive, interactive, and user-friendly. Prior to transitioning into UX Design, Meryll held various NGO programs and project management positions in Massachusetts, North Carolina, New Mexico, and Nepal.
Meryll holds a Master of Arts in Counseling Psychology and a Bachelor of Arts in Philosophy. She is currently pursuing a Master of Science in Human Factors in Information Design at Bentley University.

Rishika is a Research and Design Associate at the User Experience Center. Prior to joining the team, Rishika worked as a UX Designer for Wunderman Thompson agency in Dubai for 3 years. She collaborated with her team to do research, business analysis, and design strategy for projects. During her spare time, you find her with her friends and family or reading a book.
Rishika holds a Bachelor of Engineering in Computer Science and is currently pursuing a Master of Science in Human Factors in Information Design at Bentley University.


