Inclusive Excellence Dashboard
Inclusive Excellence Dashboard
Bentley University is committed to Inclusive Excellence meaning that all members of the community can learn and develop in an environment that supports their sense of belonging without asking them to sacrifice their authenticity. This interactive dashboard provides both static and longitudinal data that captures both the demographic makeup of the community and other measures that represent Inclusive Excellence, climate, education and institutional support. As Bentley works to implement both a strategic plan for Inclusive Excellence and Equity Goals we will continue to add to this dashboard.
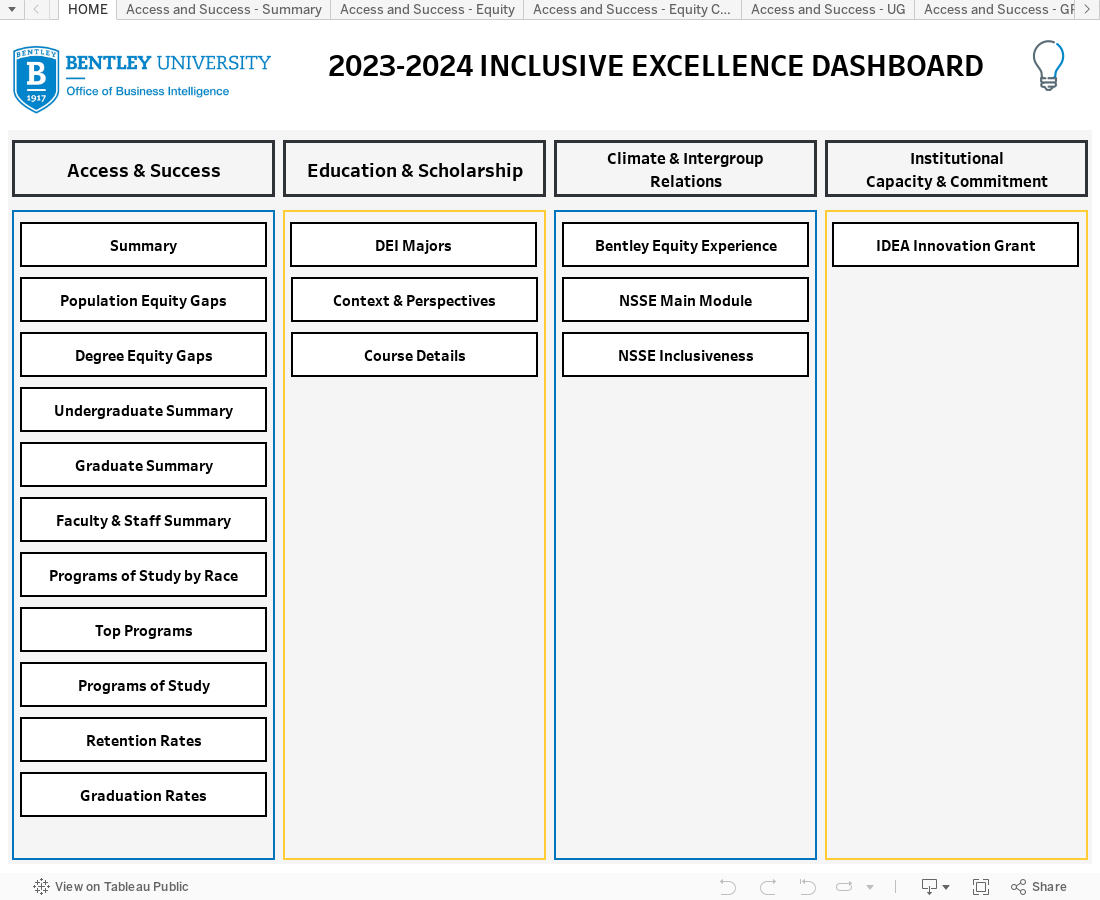
In the Dashboard below, you will find tabs showcasing data about Bentley's undergraduates, graduates and employees. Information included in these tabs include:
- Enrollment Statistics, including gender, ethnicity, first-generation status and country of origin
- Program of Study Breakdowns
- Retention and Graduation Rates
- Faculty & Staff Demographic Data
- Diversity & Intensive Courses by Academic Department
- National Survey of Student Engagement (NSSE) Results and Findings
We encourage all community members to utilize this tool when looking for university demographic and outcome data. Contact Patrick Couillard Hale (phale@bentley.edu) with any questions about this dashboard.